# react-apexcharts
**Repository Path**: trusted-list/react-apexcharts
## Basic Information
- **Project Name**: react-apexcharts
- **Description**: 📊 React Component for ApexCharts
- **Primary Language**: Unknown
- **License**: Not specified
- **Default Branch**: master
- **Homepage**: https://apexcharts.com
- **GVP Project**: No
## Statistics
- **Stars**: 0
- **Forks**: 0
- **Created**: 2026-09-08
- **Last Updated**: 2026-09-08
## Categories & Tags
**Categories**: Uncategorized
**Tags**: None
## README



React.js wrapper for ApexCharts to build interactive visualizations in react.
## Download and Installation
##### Installing via npm
```bash
npm install react-apexcharts apexcharts
```
## Usage
### Client-Side Usage (Traditional)
```js
import Chart from 'react-apexcharts'
```
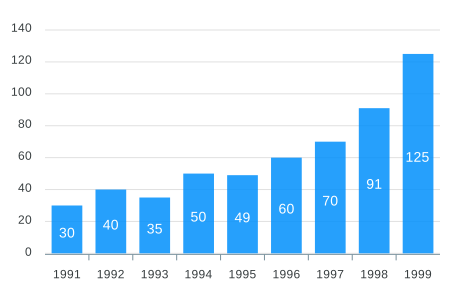
To create a basic bar chart with minimal configuration, write as follows:
```javascript
class App extends Component {
constructor(props) {
super(props);
this.state = {
options: {
chart: {
id: 'apexchart-example'
},
xaxis: {
categories: [1991, 1992, 1993, 1994, 1995, 1996, 1997, 1998, 1999]
}
},
series: [{
name: 'series-1',
data: [30, 40, 35, 50, 49, 60, 70, 91, 125]
}]
}
}
render() {
return (
)
}
}
```
This will render the following chart
### How do I update the chart?
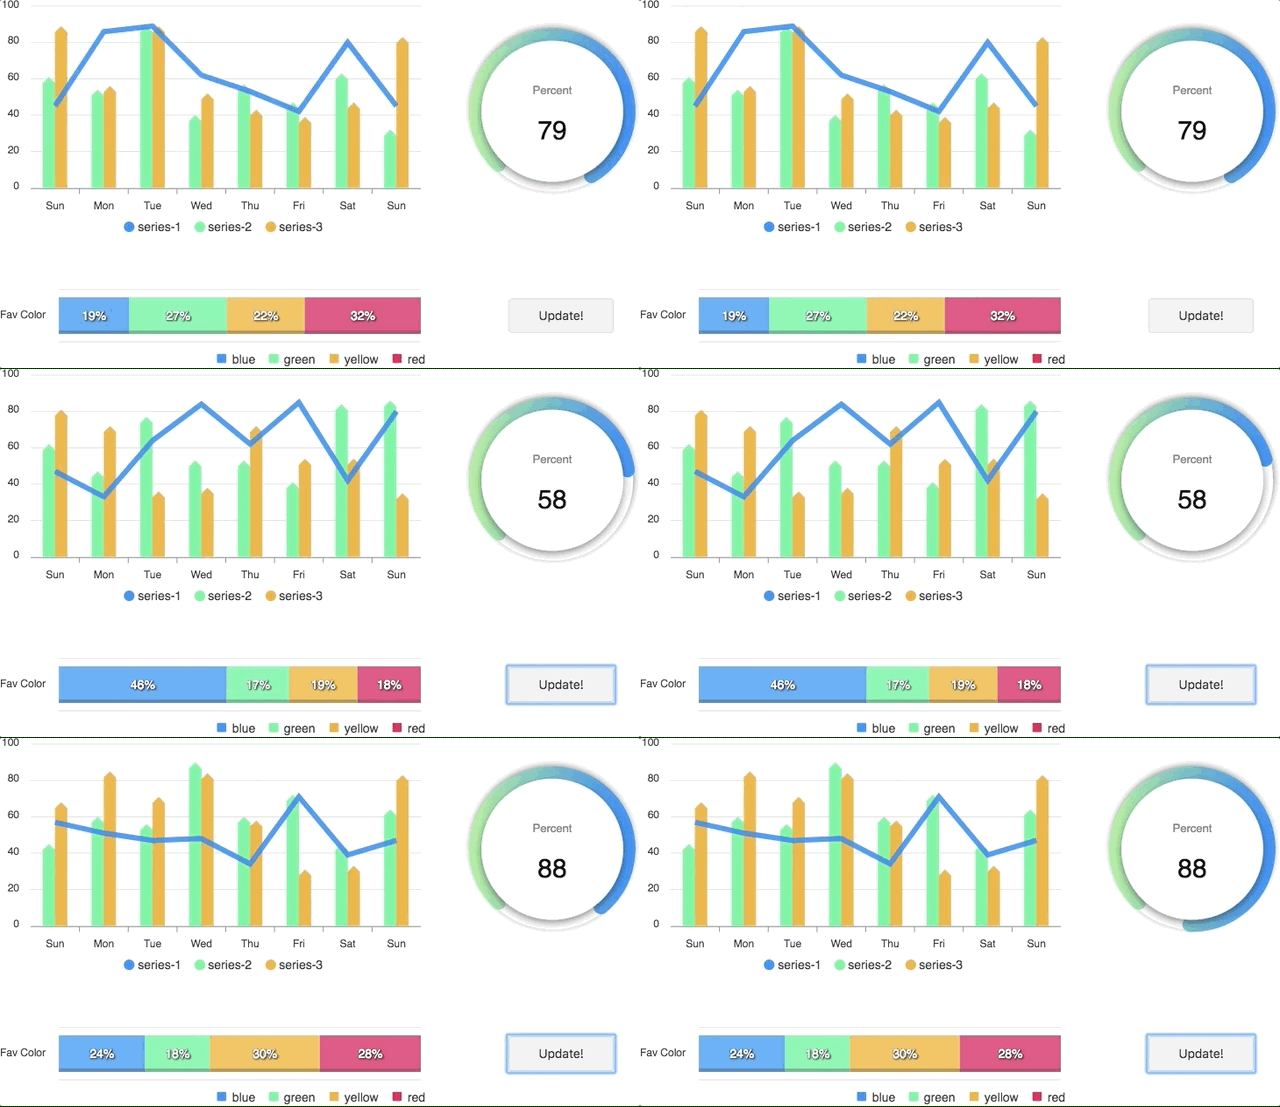
Simple! Just change the `series` or any `option` and it will automatically re-render the chart.
View this example on codesandbox
### Server-Side Rendering (SSR) with Next.js App Router
**New in v2.0.0**: react-apexcharts now supports Server-Side Rendering with Next.js 13+ App Router using ApexCharts v5.5.0+.
#### Server Component (RSC)
Render charts on the server for faster initial page loads:
```tsx
import Chart from 'react-apexcharts/server'
export default async function DashboardPage() {
const series = [{
name: 'series-1',
data: [30, 40, 35, 50, 49, 60, 70, 91, 125]
}]
const options = {
chart: { id: 'apexchart-example' },
xaxis: { categories: [1991, 1992, 1993, 1994, 1995, 1996, 1997, 1998, 1999] }
}
return (
)
}
```
#### With Client-Side Hydration
For interactive charts, combine server rendering with client-side hydration:
```tsx
// app/dashboard/page.tsx (Server Component)
import Chart from 'react-apexcharts/server'
import ChartHydrate from './ChartHydrate'
export default async function DashboardPage() {
const series = [{ data: [30, 40, 35, 50, 49, 60, 70] }]
const options = { chart: { type: 'bar' }, xaxis: { categories: ['A', 'B', 'C', 'D', 'E', 'F', 'G'] } }
return (
)
}
```
```tsx
// app/dashboard/ChartHydrate.tsx (Client Component)
'use client'
import Hydrate from 'react-apexcharts/hydrate'
export default function ChartHydrate() {
return (
)
}
```
#### Client-Only Usage in Next.js
For client-only rendering (same as before):
```tsx
'use client'
import Chart from 'react-apexcharts'
export default function ClientChart() {
const options = {
chart: { id: 'apexchart-example' },
xaxis: { categories: [1991, 1992, 1993, 1994, 1995, 1996, 1997, 1998, 1999] }
}
const series = [{
name: 'series-1',
data: [30, 40, 35, 50, 49, 60, 70, 91, 125]
}]
return
}
```
**Important:** While updating the options, make sure to update the outermost property even when you need to update the nested property.
✅ Do this
```javascript
this.setState({
options: {
...this.state.options,
xaxis: {
...this.state.options.xaxis,
categories: ['X1', 'X2', 'X3']
}
}
})
```
❌ Not this
```javascript
this.setState({
options.xaxis.categories: ['X1', 'X2', 'X3']
})
```
### Tree-Shaking (Smaller Bundles)
**New in v2.1.0**: Use the `/core` export to reduce your bundle size by only importing the chart types and features you actually use. This requires `apexcharts >=5.10.1`.
```js
// Instead of:
import Chart from 'react-apexcharts'
// Use the core variant:
import Chart from 'react-apexcharts/core'
// Then manually register only what you need:
import 'apexcharts/bar' // bar / column chart type
import 'apexcharts/line' // line / area / scatter chart type
import 'apexcharts/features/legend' // legend feature
import 'apexcharts/features/annotations' // annotations feature
// ... etc.
```
Full example:
```jsx
import Chart from 'react-apexcharts/core'
import 'apexcharts/bar'
import 'apexcharts/features/legend'
export default function BarChart() {
const series = [{ name: 'Sales', data: [30, 40, 35, 50, 49, 60, 70, 91, 125] }]
const options = {
chart: { id: 'bar-chart' },
xaxis: { categories: [1991, 1992, 1993, 1994, 1995, 1996, 1997, 1998, 1999] }
}
return
}
```
The core variant also has SSR and hydration counterparts:
```js
import Chart from 'react-apexcharts/core/server' // Server Component (async)
import Hydrate from 'react-apexcharts/core/hydrate' // Client hydration
```
> **Note for Vite users:** Add `resolve: { dedupe: ['apexcharts'] }` to your `vite.config.js` to prevent Vite from loading two separate ApexCharts instances when mixing imports.
## Props
| Prop | Type | Description |
| ------------- |-------------| -----|
| **series** | `Array` | The series is a set of data. To know more about the format of the data, checkout [Series docs](https://apexcharts.com/docs/series/) on the website. |
| **type** | `String` | `line`, `area`, `bar`, `pie`, `donut`, `scatter`, `bubble`, `heatmap`, `radialBar` |
| **width** | `Number or String` | Possible values for width can be `100%`, `400px` or `400` (by default is `100%`) |
| **height** | `Number or String` | Possible values for height can be `100%`, `300px` or `300` (by default is `auto`) |
| **options** | `Object` | The configuration object, see options on [API (Reference)](https://apexcharts.com/docs/options/chart/type/) |
| **chartRef** | `React.RefObject` | Pass a ref to get access to the underlying ApexCharts instance for imperative API calls |
## How to call methods of ApexCharts programmatically?
Sometimes, you may want to call other methods of the core ApexCharts library, and you can do so on `ApexCharts` global variable directly
Example
```js
ApexCharts.exec('reactchart-example', 'updateSeries', [{
data: [40, 55, 65, 11, 23, 44, 54, 33]
}])
```
More info on the `.exec()` method can be found here
All other methods of ApexCharts can be called this way
## What's included
The published package includes the following files.
```
react-apexcharts/
├── dist/
│ ├── react-apexcharts.cjs.js # CommonJS (default import)
│ ├── react-apexcharts.esm.js # ES Module (default import)
│ ├── react-apexcharts.iife.min.js # IIFE for browser