# Leaflet.CanvasLayer.Field
**Repository Path**: gitsource_zdb/Leaflet.CanvasLayer.Field
## Basic Information
- **Project Name**: Leaflet.CanvasLayer.Field
- **Description**: No description available
- **Primary Language**: Unknown
- **License**: GPL-3.0
- **Default Branch**: master
- **Homepage**: None
- **GVP Project**: No
## Statistics
- **Stars**: 0
- **Forks**: 0
- **Created**: 2021-05-10
- **Last Updated**: 2024-05-29
## Categories & Tags
**Categories**: Uncategorized
**Tags**: None
## README
# IH.Leaflet.CanvasLayer.Field
A plugin for [LeafletJS](http://www.leafletjs.com) that adds layers to visualize fields (*aka* **Rasters**) from ASCIIGrid or GeoTIFF files (EPSG:4326).
### Warning! New url for npm install
```
npm install ih-leaflet-canvaslayer-field
```
**[Leaflet.CanvasLayer.Field EXAMPLES](https://ihcantabria.github.io/Leaflet.CanvasLayer.Field/)**

[](https://badge.fury.io/js/ih-leaflet-canvaslayer-field)
It includes:
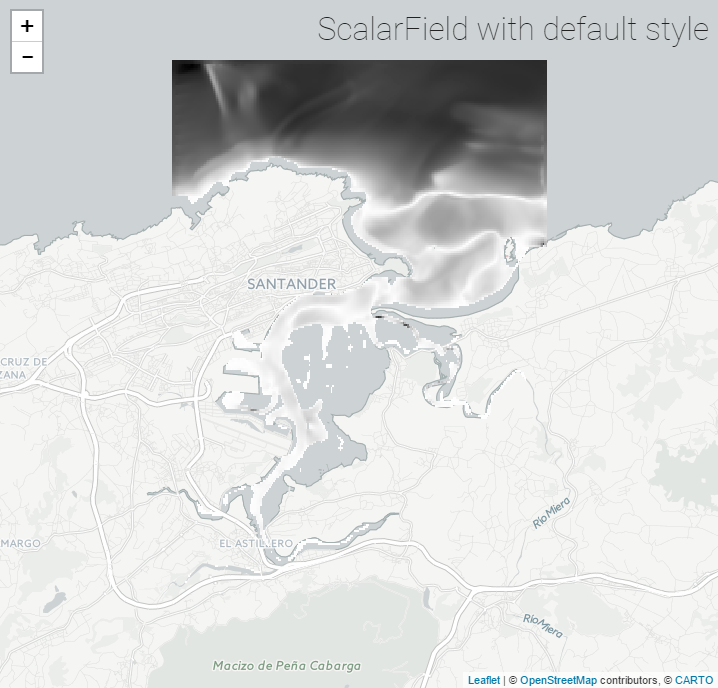
* `L.CanvasLayer.ScalarField` - a "typical" raster layer (from scalars such as DTM, temperature...) that can be rendered with different color scales and arrows.
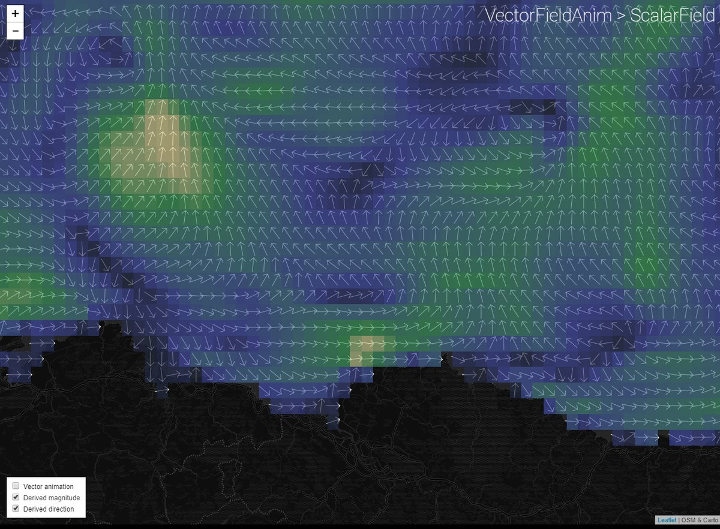
* `L.CanvasLayer.VectorFieldAnim` - an animated layer representing a vector field (wind, currents...), based on the excellent [earth](https://github.com/cambecc/earth) by Cameron Becarrio
This plugin extends [L.CanvasLayer](https://github.com/Sumbera/gLayers.Leaflet) Leaflet Plugin by Stanislav Sumbera and uses [geotiff.js](https://github.com/constantinius/geotiff.js) by Fabian Schindler. For the 'arrow' renderer, it includes a modified portion of [leaflet-geotiff](https://github.com/stuartmatthews/leaflet-geotiff) by
Stuart Matthews.
## Demo
The figures below show the results for three basic layers, showing *Currents in the Bay of Santander (Spain)*
The following animation shows the usage of the built-in Layers Player controller to display an hypothetical *precipitation event in the North American Great Lakes region*.
If you want to have a quick testing environment, have a look at these **snippets at codepen.io**:
* [ScalarField](http://codepen.io/VictorVelarde/pen/ZKJWMb/)
* [VectorFieldAnim](http://codepen.io/VictorVelarde/pen/QvBeYV)
## Instructions
### Basic Usage
1. Get the JavaScript file. You can grab a copy from ongoing work at [leaflet.canvaslayer.field.js](https://ihcantabria.github.io/Leaflet.CanvasLayer.Field/dist/leaflet.canvaslayer.field.js). If you prefer to work locally with npm, then go with `npm install ih-leaflet-canvaslayer-field --save`. Every version is automatically published to `unpkg CDN` (last version at: https://unpkg.com/leaflet-canvaslayer-field/dist/leaflet.canvaslayer.field.js)
2. Include the JavaScript dependencies in your page:
```html
```
3. Prepare a Raster File with your favourite GIS tool, using [EPSG:4326](https://epsg.io/4326) (**ASCII Grid** or **GeoTIFF** format)
4. Create a `ScalarField` layer and add it to the `map`, using your raster files as source (e.g. this .asc)
```js
d3.text("https://ihcantabria.github.io/Leaflet.CanvasLayer.Field/data/Bay_Speed.asc", function (asc) {
var s = L.ScalarField.fromASCIIGrid(asc);
var layer = L.canvasLayer.scalarField(s).addTo(map);
map.fitBounds(layer.getBounds());
});
```
5. Or try the `VectorFieldAnim` layer, adding also a popup (previously you have to prepare 2 raster files, with 'u' and 'v' components in 'm/s'):
```js
d3.text('https://ihcantabria.github.io/Leaflet.CanvasLayer.Field/data/Bay_U.asc', function(u) {
d3.text('https://ihcantabria.github.io/Leaflet.CanvasLayer.Field/data/Bay_V.asc', function(v) {
let vf = L.VectorField.fromASCIIGrids(u, v);
let layer = L.canvasLayer.vectorFieldAnim(vf).addTo(map);
map.fitBounds(layer.getBounds());
layer.on('click', function(e) {
if (e.value !== null) {
let vector = e.value;
let v = vector.magnitude().toFixed(2);
let d = vector.directionTo().toFixed(0);
let html = (`${v} m/s to ${d}°`);
let popup = L.popup()
.setLatLng(e.latlng)
.setContent(html)
.openOn(map);
}
});
});
});
```
### Developers
* This plugin works with Leaflet >=v1.0.0
* `node` & `npm` are needed to build and test the plugin, and it uses `webpack 2` as module bundler. To use it just:
```shell
npm install
npm run start
```
* Navigate to docs/index.html for some examples.
## License
Licensed under the GNU General Public License v3.0
This software currently depends a copy of:
* [gLayers.Leaflet](https://github.com/Sumbera/gLayers.Leaflet) - MIT License
At runtime it uses:
* [chroma.js](https://github.com/gka/chroma.js) - BSD License
* [@turf/inside](https://github.com/Turfjs/turf) - MIT License
* [geotiff.js](https://github.com/constantinius/geotiff.js) - MIT License
* [d3js](https://github.com/d3/d3) - BSD License