
**The CodeGraph platform is coming** — for every PR, know exactly what to test, what could break, which flows are affected, and whether business logic is compromised.
 Get early beta access to the hosted product · getcodegraph.com
Get early beta access to the hosted product · getcodegraph.com
Get early beta access to the hosted product · getcodegraph.com


codegraph sync manually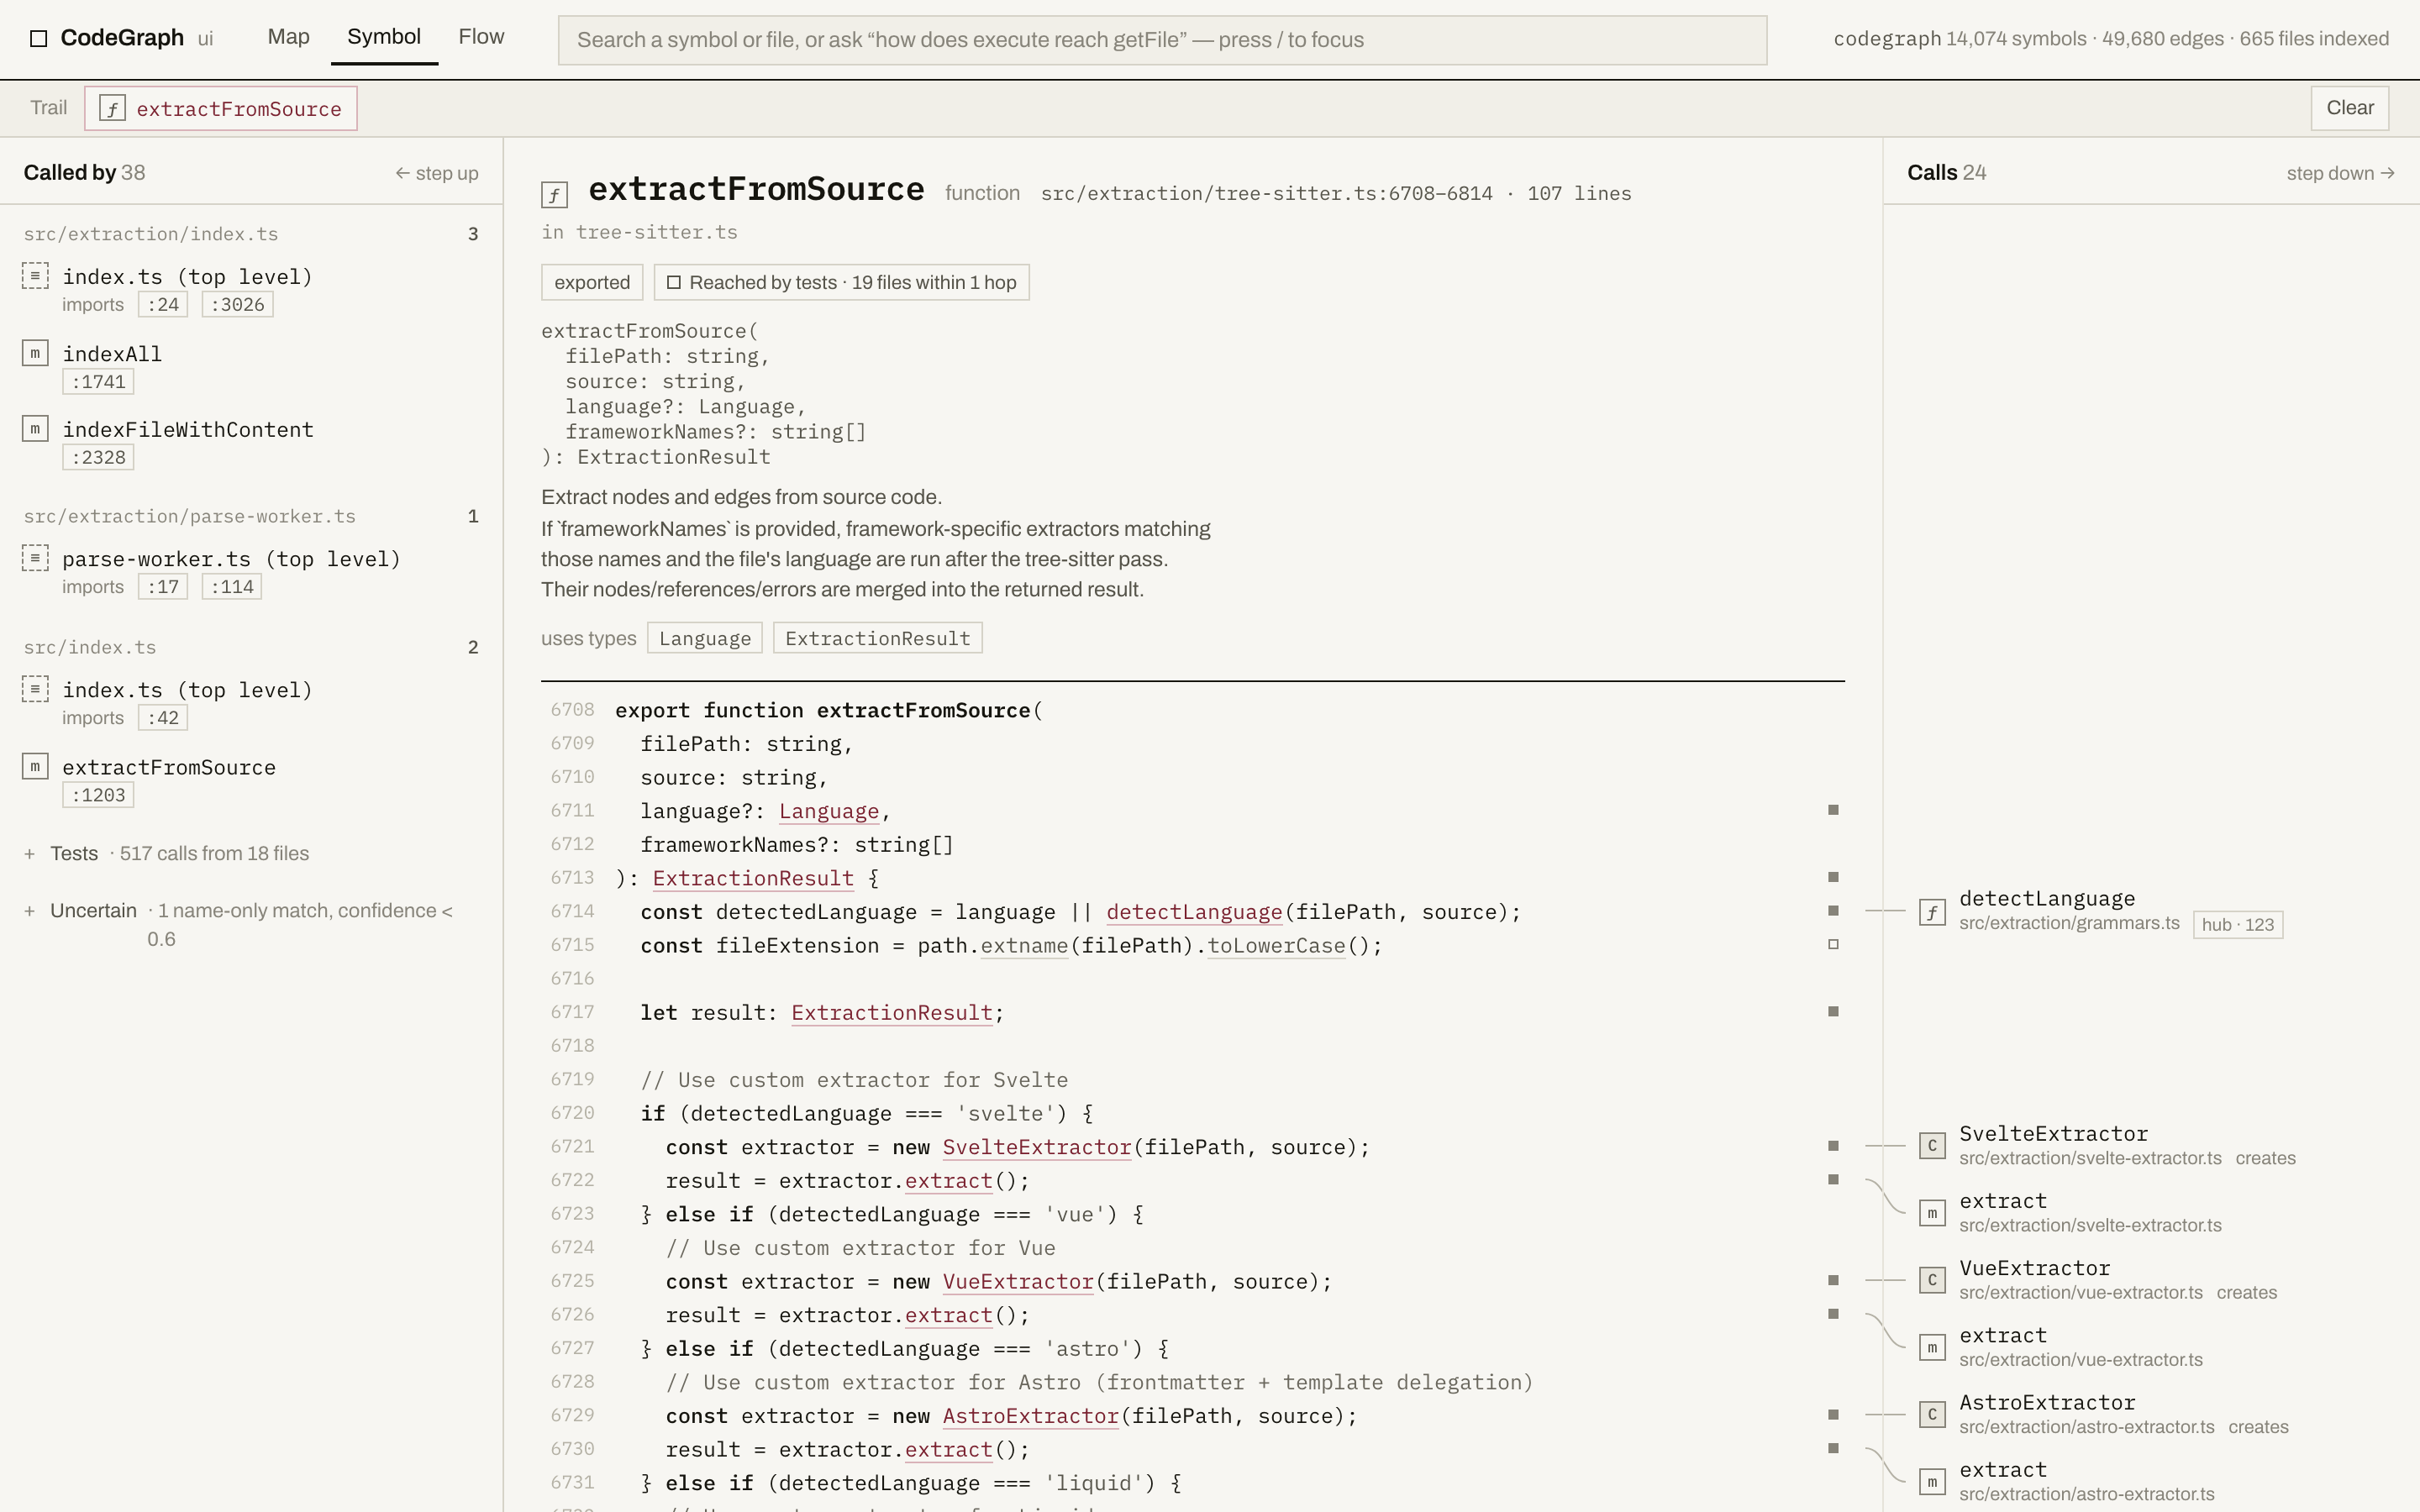 What you get on that screen:
- **Callers, grouped by file**, each with the exact line it calls from — click one to jump there. Test callers fold into a single line so real callers stay in view.
- **The real source**, syntax-highlighted, with a marker in the gutter on every line that calls something.
- **Callees on the right**, positioned at the line that calls them, joined by a hairline. Hover either end and both light up.
- **Blast radius** — direct dependents, everything within three hops, and how many files and test files that touches.
- **Honest edges.** A guess CodeGraph isn't sure about is folded away as "uncertain" rather than shown as fact, and a symbol no test reaches within three hops says so.
- **Search** (`/` or ⌘K) over every symbol and file, and a **trail** of the path you walked that lives in the URL, so you can send someone the exact route you took. Typing a name also surfaces matching **entry points** under their own heading, so a URL comes back with the symbol that serves it rather than on its own.
- **Entry points** — the first screen on a codebase you have never opened, and the answer to "where does anything start". Every route with its handler and the line it is registered on, grouped by router file and named with the framework it was detected from; the files that run something at import time (a CLI, a worker entry, a script); the tests, ranked by how much of the project each one exercises; and the symbols the most code depends on. Nothing is guessed from a filename — it is all read out of the graph, and a project with no routes says so instead of drawing an empty list. Any row that names a symbol can start a **flow**: pick a second symbol and you get the path between them, so "how does `POST /v1/payroll/cycles/{cycleID}/run` reach the database" is two clicks.
- Click any file path to open the **file view**: everything that file depends on, its outline in source order, and everything that depends on it. Its **Source** tab shows the whole file with the same gutter markers, plus an arc in the left margin for every call that stays inside the file — the one place a file's internal call structure is legible, because source order does the layout. A 6,800-line file scrolls at full speed.
- **Ask for a path.** Type "how does execute reach getFile" (or `execute -> getFile`) and you get the **flow**: one card per hop, each opened at the line that makes the next call. Hops that no static edge records — a callback, an interface dispatch, a React re-render — are drawn dashed and name where the handler was wired. "Read as flow" turns a walk you did by hand into the same strip.
- **And when the path runs out, it says where.** A flow that doesn't get there ends in "Where the graph stops": the kind of dispatch that ended it (a computed member call, a `getattr`, a reflective invoke, a message bus), its line, the key when the source spells one out, and a shortlist of what could be on the other side — plus the name-only matches CodeGraph refused to follow, with their confidence. Nothing is guessed, and a flow that does connect never shows it.
- **What happens from here.** On an app with screens, the **Screens** tab draws one box per screen and an arrow for every way of getting from one to another, each labelled with the condition under which it happens. The **Steps** tab does the same for what happens *on* a screen: pick one (or any symbol) and you get its handlers, the calls that cross into native code, the native events that come back, the store actions it writes and the requests that leave the app, as typed steps with the plumbing between them folded into the arrows — the whole capture-to-upload flow of a React Native app on one picture, with every step a click from the next anchor or a Flow strip.
- **The map**: the whole project at module granularity, laid out from the graph with dependencies pointing down — never drawn by hand, and the same picture every time. Cycles are listed rather than straightened away.
- **Take the picture with you.** A flow strip or a map can be copied as an image straight into a pull-request comment, or saved as an SVG for a README — always in the light theme, whichever one you are reading in, with a caption saying what the picture is. The SVG is real text, so it stays sharp at any size and the names in it are selectable.
- **Keep a walk.** Press **Save trail** on the trail bar, name it, and the path is kept — listed on the empty screen and on Entry points, above the suggestions, and reopened at the symbol you left with the whole walk restored. Steps are remembered by what they are, not where they sat, so a saved trail survives editing the code it describes; when something does move it says which step moved, which was renamed away, and how much of the walk still opens. Trails are plain JSON under `.codegraph/ui/trails/` (git already ignores it), and **Export** hands you the file if you would rather commit one.
- **It keeps up.** Save a file and a banner appears within about a third of a second saying the index hasn't caught up yet — and the screen switches to the file's current source rather than a body sliced at lines it no longer has. When something re-indexes, whatever is on screen refetches itself and says "Index updated · reloaded". A symbol that moved because you added a line above it is followed, not lost. Nothing polls: the viewer watches, and if it loses touch with the server it retries a few times and then says so instead of hammering it.
Options: `--port
What you get on that screen:
- **Callers, grouped by file**, each with the exact line it calls from — click one to jump there. Test callers fold into a single line so real callers stay in view.
- **The real source**, syntax-highlighted, with a marker in the gutter on every line that calls something.
- **Callees on the right**, positioned at the line that calls them, joined by a hairline. Hover either end and both light up.
- **Blast radius** — direct dependents, everything within three hops, and how many files and test files that touches.
- **Honest edges.** A guess CodeGraph isn't sure about is folded away as "uncertain" rather than shown as fact, and a symbol no test reaches within three hops says so.
- **Search** (`/` or ⌘K) over every symbol and file, and a **trail** of the path you walked that lives in the URL, so you can send someone the exact route you took. Typing a name also surfaces matching **entry points** under their own heading, so a URL comes back with the symbol that serves it rather than on its own.
- **Entry points** — the first screen on a codebase you have never opened, and the answer to "where does anything start". Every route with its handler and the line it is registered on, grouped by router file and named with the framework it was detected from; the files that run something at import time (a CLI, a worker entry, a script); the tests, ranked by how much of the project each one exercises; and the symbols the most code depends on. Nothing is guessed from a filename — it is all read out of the graph, and a project with no routes says so instead of drawing an empty list. Any row that names a symbol can start a **flow**: pick a second symbol and you get the path between them, so "how does `POST /v1/payroll/cycles/{cycleID}/run` reach the database" is two clicks.
- Click any file path to open the **file view**: everything that file depends on, its outline in source order, and everything that depends on it. Its **Source** tab shows the whole file with the same gutter markers, plus an arc in the left margin for every call that stays inside the file — the one place a file's internal call structure is legible, because source order does the layout. A 6,800-line file scrolls at full speed.
- **Ask for a path.** Type "how does execute reach getFile" (or `execute -> getFile`) and you get the **flow**: one card per hop, each opened at the line that makes the next call. Hops that no static edge records — a callback, an interface dispatch, a React re-render — are drawn dashed and name where the handler was wired. "Read as flow" turns a walk you did by hand into the same strip.
- **And when the path runs out, it says where.** A flow that doesn't get there ends in "Where the graph stops": the kind of dispatch that ended it (a computed member call, a `getattr`, a reflective invoke, a message bus), its line, the key when the source spells one out, and a shortlist of what could be on the other side — plus the name-only matches CodeGraph refused to follow, with their confidence. Nothing is guessed, and a flow that does connect never shows it.
- **What happens from here.** On an app with screens, the **Screens** tab draws one box per screen and an arrow for every way of getting from one to another, each labelled with the condition under which it happens. The **Steps** tab does the same for what happens *on* a screen: pick one (or any symbol) and you get its handlers, the calls that cross into native code, the native events that come back, the store actions it writes and the requests that leave the app, as typed steps with the plumbing between them folded into the arrows — the whole capture-to-upload flow of a React Native app on one picture, with every step a click from the next anchor or a Flow strip.
- **The map**: the whole project at module granularity, laid out from the graph with dependencies pointing down — never drawn by hand, and the same picture every time. Cycles are listed rather than straightened away.
- **Take the picture with you.** A flow strip or a map can be copied as an image straight into a pull-request comment, or saved as an SVG for a README — always in the light theme, whichever one you are reading in, with a caption saying what the picture is. The SVG is real text, so it stays sharp at any size and the names in it are selectable.
- **Keep a walk.** Press **Save trail** on the trail bar, name it, and the path is kept — listed on the empty screen and on Entry points, above the suggestions, and reopened at the symbol you left with the whole walk restored. Steps are remembered by what they are, not where they sat, so a saved trail survives editing the code it describes; when something does move it says which step moved, which was renamed away, and how much of the walk still opens. Trails are plain JSON under `.codegraph/ui/trails/` (git already ignores it), and **Export** hands you the file if you would rather commit one.
- **It keeps up.** Save a file and a banner appears within about a third of a second saying the index hasn't caught up yet — and the screen switches to the file's current source rather than a body sliced at lines it no longer has. When something re-indexes, whatever is on screen refetches itself and says "Index updated · reloaded". A symbol that moved because you added a line above it is followed, not lost. Nothing polls: the viewer watches, and if it loses touch with the server it retries a few times and then says so instead of hammering it.
Options: `--port